The model number of the DBA digitizer at MGH is: M2100 ImageClear. Cases with a filename beginning with the letter 'A' came from MGH. There were two scanners used at MGH. Cases that have DBA in the .ics file were scanned on the DBA scanner at MGH and can be calibrated to optical density with the equations in this file.
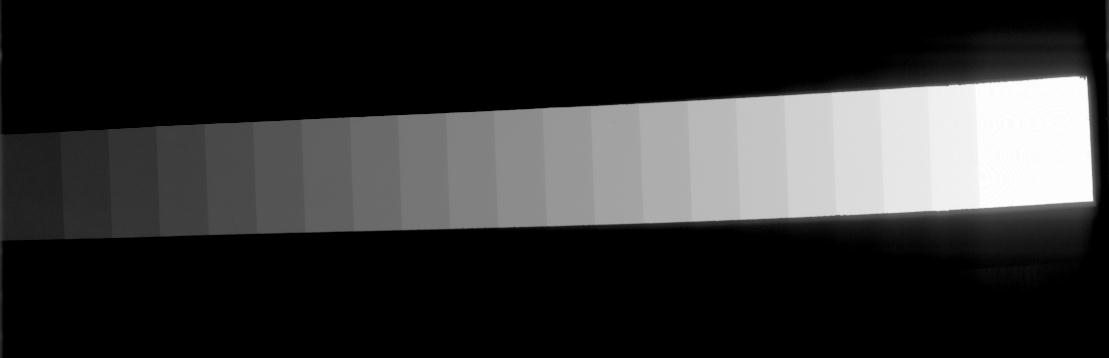
On the film, the optical density of each of the 21 wedges was measured as well
as that of the film background. On the 210 micron image, the grey level mean
and standard deviation of an 80 by 30 pixel region (240 pixels) within each
wedge and the film background was computed. Here's the results of these
measurements:
   Measured  	  Grey Level Mean
Optical Density	(Standard Deviation)
---------------	--------------------
     0.04	    55722 (350.3)
     0.21	    37201 (583.6)
     0.34	    26986 (318.4)
     0.50	    18445 (217.1)
     0.69	    12569 (148.0)
     0.82	     8296 ( 99.9)
     0.96	     5648 (106.5)
     1.13	     3797 ( 44.4)
     1.28	     2603 ( 32.7)
     1.44	     1772 ( 22.7)
     1.59	     1217 ( 18.2)
     1.74	      847 ( 13.4)
     1.89	      581 (  9.0)
     2.07	      393 (  6.1)
     2.21	      271 (  4.3)
     2.37	      185 (  3.2)
     2.52	      132 (  2.7)
     2.68	       94 (  2.5)
     2.84	       65 (  2.1)
     2.99	       47 (  1.8)
     3.13	       34 (  1.6)
     3.60	        5 (  1.1)
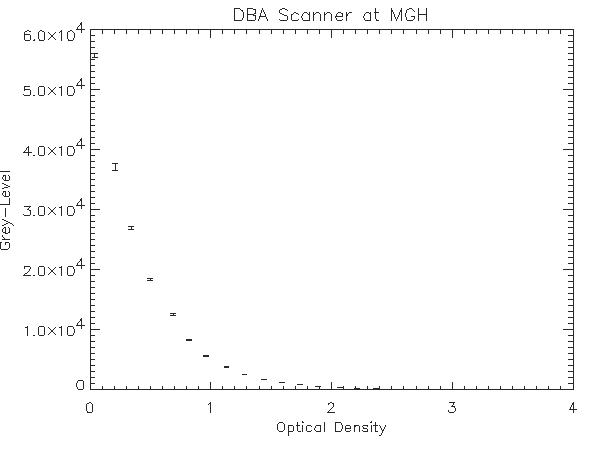
Here's a plot of mean grey level versus the measured optical density of the step wedge phantom. The error bars indicate the standard deviation of the grey levels within each wedge.
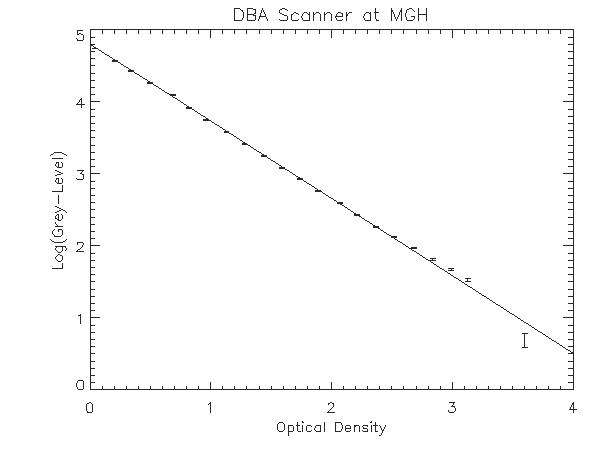
Using simple regression to fit a line to the data, we get a slope of -1.07553, and a y-intercept of 4.80662. The equation for the line is:
So, to convert a grey level (GL) value to optical density (OD), simply use the
following equation:
| Eq. 1 | OD = ( log(GL) - 4.80662 ) / -1.07553 |
Example: Using Equation 1, A grey level of 1217 maps to an optical density of 1.60045. Looking at the table of measured OD values, we see that a grey level of 1217 mapped to a measured optical density of 1.59. The small discrepancy can be attributed to the noise in the experimental measurement of the OD function, and the noise introduced by the digitization process.