Cases with a filename beginning with the letter 'A' came from MGH. There were two scanners used at MGH. Cases that have HOWTEK in the .ics file were scanned on the HOWTEK scanner at MGH and can be calibrated to optical density with the equations in this file.
A step-wedge phantom film was scanned on the HOWTEK scanner at the full 43.5 micron per pixel spatial resolution. A rotated, 8x aggregated version of the scanned step-wedge is displayed below.
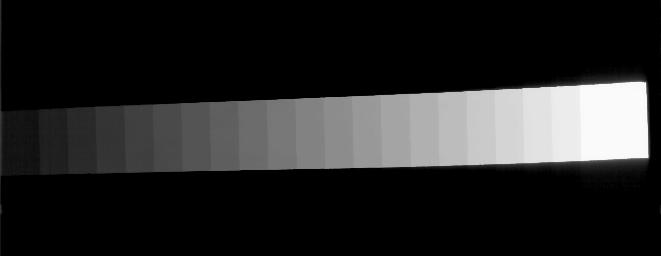
The optical density of each step was measured several times, and the average values were calculated. The step-wedge was scanned on six days over a 16 day period. The mean and the standard deviation was then calculated for each step in each (43.5 micron) scanned image. The average of the 6 means and of the 6 standard deviations were then computed for each step. The results are listed below:
   Measured  	  Grey Level Mean
Optical Density	(Standard Deviation)
---------------	--------------------
    3.0600            820  (67.75)
    2.9067            973  (49.15)
    2.7433           1117  (33.41)
    2.6033           1267  (29.57)
    2.4500           1425  (24.51)
    2.3033           1565  (19.21)
    2.1500           1710  (18.81)
    2.0000           1863  (17.52)
    1.8400           2036  (13.33)
    1.6900           2200  (12.65)
    1.5467           2355  (10.80)
    1.3967           2498  (10.69)
    1.2400           2663  (11.72)
    1.0933           2830  ( 9.38)
    0.9367           2990  ( 9.09)
    0.7900           3158  (10.83)
    0.6300           3341  ( 9.11)
    0.4800           3501  ( 9.37)
    0.3300           3681  (10.11)
    0.2100           3826  (12.25)
    0.0400           4012  ( 4.96)
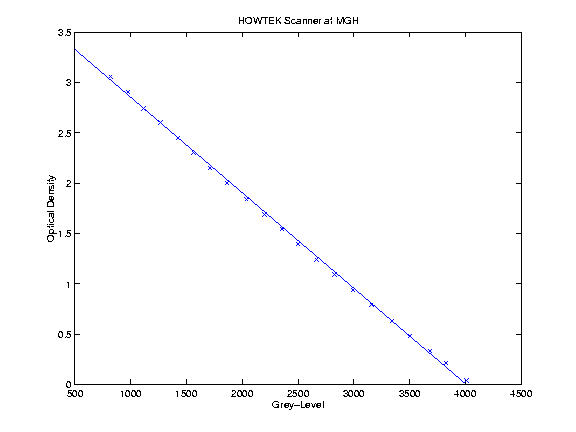
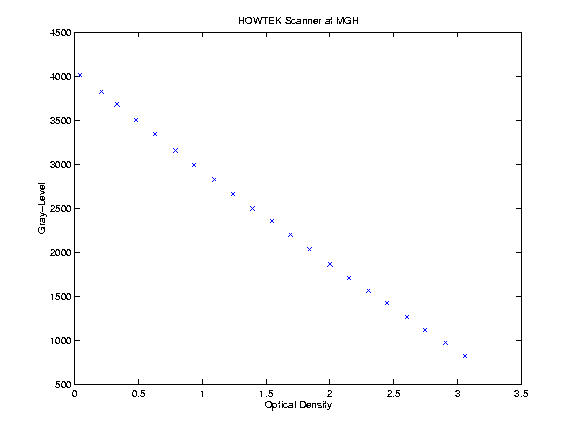
Here is a plot of mean grey level versus the measured optical density of the step wedge phantom.
Using simple regression to fit a line to the data, we get an intercept of 4005.7
and a slope of -1056.6.
So, to convert a grey level (GL) value to optical density (OD), simply use the
following equation:
| Eq. 1 | OD = 3.789 - 0.00094568 * GL |