
Research Highlight 2: Hydraulic and Disinfection Efficiencies of a Full-Scale Ozone Contactor using a RANS-based Modeling Framework
Introduction: Modeling approaches have been employed to predict pathogen removal in disinfection tanks for decades. The capability of predicting hydraulic and disinfection efficiencies of ozone disinfection contactors is essential for evaluating existing contactors and improving future designs. The recent regulations on disinfection by-products (e.g. 10 micro-g/L for bromate since 2008 in the EU) have made modeling even more important for the management of ozone disinfection process.
In the present
study, we develop a novel
CFD-based framework comprised of a kinetics-based model for ozonation process in
ozone contactors, and for the first time validate the predicted bromate formation
via comparisons with measured physical data. The contribution of this
study relative to previous studies is summarized in Figure 1. In the
present framework, the single phase mean flow is calculated by RANS (Reynolds-averaged Navier-Stokes) simulation,
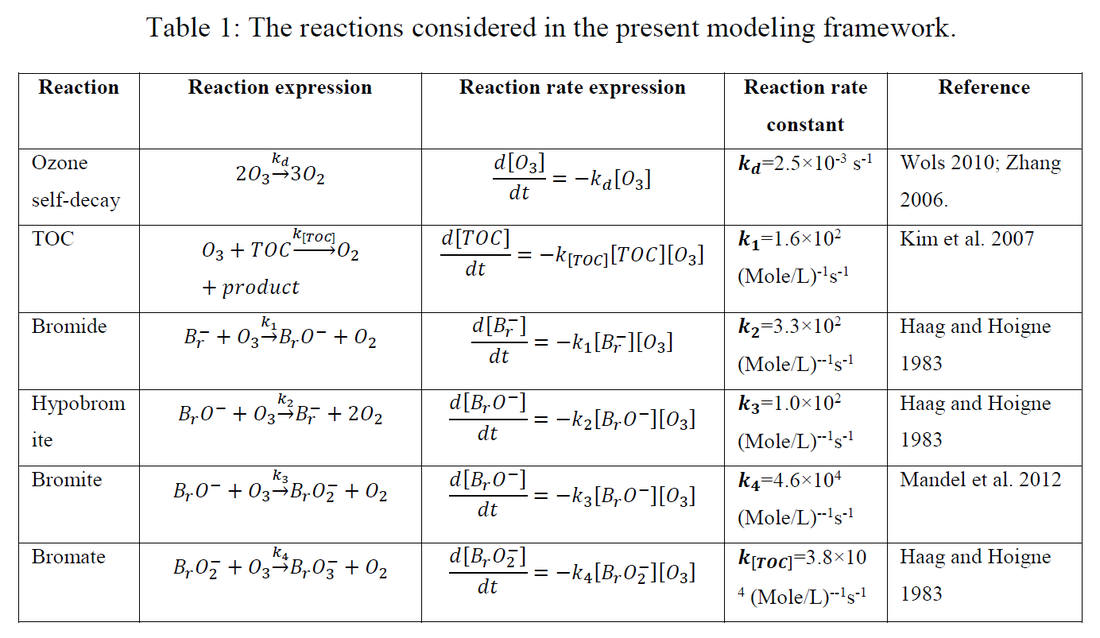
the reaction system for ozonation process includes ozone self-decomposition,
reaction between ozone and natural organic matter, and bromate formation, and a
kinetics-based model is applied to model the bromate formation. This framework
is validated via simulation of the full-scale ozone contactor in the City of
Tampa Water Department, David L. Tippin
Water Treatment Facility. Predictions of ozone and bromate concentrations by the present framework agree well with measured physical data.

Figure 1. Frameworks of previous full-scale contactor tank studies
Computational Setup: < /span > The code used to carry out the simulations is the open source numerical library OpenFOAM (2010), an acronym for Open source Field Operations and Manipulations. OpenFOAM is a collection of C++ libraries, designed for solving continuum mechanics problems. OpenFOAM uses the finite volume method to discretize the governing flow and scalar transport equations. Pressure-velocity coupling is accomplished using the well-known SIMPLE method, while non-linear advection terms are discretized with a second order accurate upwind scheme and diffusion terms are discretized with a central finite difference scheme.
To validate the framework developed in the present study, simulations of a full scale ozone disinfection contactor operated by the City of Tampa Water Department were conducted. The layout of the ozone contactor is shown in Figure 2(a,b). The concentrations of ozone were sampled at points A, B, and C in the contactor, also shown in Figure 2(a). Note that all the sample points are 1 foot away (higher/lower) from the top or bottom of the baffles. The concentrations of bromide and bromate were sampled at the inlet and outlet of the ozone contactor only. In order to compare with the data measured on site, the computational domain in the present study includes the middle eight chambers of the ozone contactor. The size of this computational domain is Length x Width x Height = 51.7m x 12.2m x 7.32m. The rest of the dimensions of the contactor including the dimensions of the baffles are given in Figure 2(b). The mesh used for all simulations has 881,050 structured cells, shown in Figure 2(c). The water extends to a height H = 7.32m above the bottom and does not fill the entire contactor. The free-surface is treated as a no-penetration, zero-shear, rigid lid allowing full slip. Velocity inlet boundary condition with a fixed flow rate is applied to the inlet. Pressure is imposed at the outlet. No-slip conditions are imposed at the bottom and other walls. The viscous wall regions are not resolved, however, everywhere the first grid point away from a no-slip boundary is less than 85 plus units (Zhang et al, 2013) permitting the use of the standard k-e turbulence model (Wilcox, 1994). Our use of the standard k-e model is further motivated by the accurate RANS results of Zhang et al. (2013a) of a laboratory baffled contactor described earlier in the introduction.

Five scenarios (scenarios I-V) with weekly averaged data measured on site from April to July 2011 were selected to set up the chemical reaction simulations and to compare with simulation predictions. The flow rates in the ozone contactor were kept constant during each scenario, but vary from 45 to 55 MGD (million gallons per day) from scenario to scenario, as listed in Table 2. Different flow rates from those of Table 2 were used to conduct numerical tracer transport simulations in order to cover a wider range of flow rates. In the tracer simulations, the flow rates used are 33.8, 46.0 and 63.8 MGD, corresponding to the minimum flow rate in 2011, the averaged flow rate in April 2011, and the maximum flow rate in 2011.
In the numerical tracer simulations, a tracer pulse was released at the inlet within the first 2% of the theoretical residence time period. Note that the theoretical residence time varies from 2,180 s to 1,848 s. Other necessary inputs for the chemical reaction simulations, such as ozone dose or ozone concentration at diffuser, TOC concentration at inlet, TOC concentration removed by the ozone contactor, and bromide concentration at inlet are listed in Table 2. At the outlet and at the walls, the normal gradients of the tracer and chemical species are set to zero indicating zero diffusive flux across these boundaries.
Operation parameters based on weekly averaged data in the ozone contactor of the City of Tampa Water Department used for chemical reaction simulations.
| Scenario I | Scenario II | Scenario III | Scenario IV | Scenario V | |
|---|---|---|---|---|---|
| Duration | Apr 4-12 | Apr 27-May 2 | May 19-25 | Jun 4-Jun 16 | Jun 30-Jul 11 |
| Flow rate/MGD | 45.40 | 50.65 | 54.53 | 55.39 | 45.82 |
| pH | 6.500 | 6.550 | 6.430 | 6.310 | 6.280 |
| Ozone conc. at diffuser/mg/L | 2.982 | 4.975 | 2.744 | 1.903 | 1.770 |
| TOC conc. at inlet/mg/L | 3.200 | 4.900 | 3.200 | 1.800 | 1.350 |
| TOC conc. removed by the ozone contactor/mg/L | 0.400 | 0.400 | 0.200 | 0.000 | 0.000 |
| Bromide conc. at inlet/mg/L | 0.036 | 0.053 | 0.150 | 0.242 | 0.137 |

Figure 3. (a) Speed contours and (b) streamlines on the streamwise-vertical (x1-x2) plane at mid-span of the simulated full-scale ozone contactor for scenario I. Note that, the flow direction is from right to left.
Figure 4 (a-e) shows the distribution of ozone concentration on the streamwise-vertical plane at mid-span of the ozone contactor for scenarios I through V, respectively. For all scenarios, the following phenomena are similar: a high ozone concentration region can be observed at the bottom of chambers 1 and 2 since it is where the ozone diffuser is located. In the first chamber, dissolved ozone accumulates within the dead zone while the ozone concentration in the high-speed core jet is relative low. However, in the second chamber, the ozone concentration in the high-speed core jet is much higher than that in the dead zone. This is because the ozone diffuser in the first chamber is mostly located within the region of the dead zone while the ozone diffuser in the second chamber is located within the region of the high-speed core jet. In the following six chambers, the ozone concentration in the high-speed jet region is higher than that in the dead zones, as there are no ozone sources within these chambers. Note that transfer of ozone between dead zones and high-speed jet is by diffusion.
Comparing panels (a), (b), (c), (d), and (e) in Figure 4, the overall ozone concentration in scenario II is higher than the others, due to its high ozone dose at the diffuser. Note that concentration of ozone in scenario I is lower than that in scenario III in spite of the ozone dose at the diffuser in scenario I being higher than that in scenario III. The reason is that the influent TOC concentration in scenario I is much higher than that in scenario III. Such influent consumes more ozone and consequently results in the lower ozone concentration in the first chamber in scenario I.

Figure 4. Ozone concentration contour on center plane of the ozone contactor for scenarios (a) I, (b) II, (c) III, (d) IV, and (e) V. Note that the flow direction is from right to left (i.e. from chamber #1 through #8).
In Figure 5, the predicted ozone concentrations are compared with physical experimental data for all scenarios at the sample points marked in Figure 2a. In this figure, it can be observed that all the data points are close to the bisector with an R-square equal to 0.93. This indicates that the predictions of ozone concentrations have good agreement with the physical experimental data, serving to validate the chemical reaction simulations conducted as well as the overall computational framework. Furthermore, now that the predicted ozone concentration distribution has been shown to be reliable it may be used for the prediction of contact time or CT distribution, as will described below.

Figure 5. Comparison of predicted and measured ozone concentration at the sample points A, B, and C for different scenarios.
Based on the predicted ozone distribution in the contactor, CT (contact time) distributions were obtained by solving the transport equation for CT. These CT distributions are shown in Figure 6. For all the scenarios, a CT gradient exists across the dead zones and the high-speed core jet in the first two chambers. For subsequent chambers, this CT gradient gradually disappears as CT distribution tends to be uniform within each chamber. The average value of CT at contactor outlet varies depending on the overall ozone concentration distribution and the mean residence time. The average values of CT at contactor outlet for the five scenarios are 14.04, 22.06, 13.19, 9.56, and 9.97 mg min/L respectively. The average CT in scenario II (22.06 mg min/L) is the highest among the five scenarios. This is mainly because scenario II has the highest ozone distribution, as can be seen in Figure 4. Although scenario I has the lowest ozone concentration distribution, it still has the second highest CT value at 14.04 mg min/L. The reason is that scenario I has the longest mean residence time (2,220 sec) which is approximately 22% higher than the shortest mean residence time (1,820 sec) in the five scenarios, based on assuming mean residence time is approximately equal to theoretical residence time for the cases studied here. (Note that based on the tracer simulations performed, the mean residence time tends to be very close to the theoretical residence time, therefore, it is reasonable to use the theoretical residence time to represent the mean residence time here.) In conclusion, besides ozone dose, the mean residence time, which is related to seasonal flow rate change, is also a critical factor for determining the disinfection efficiency measured in terms of CT. The predicted average CT values at the outlet for all the scenarios studied are higher than 7.8 mg min/L which is the most strict ozonation CT requirement for 99 percent inactivation of common pathogens, such as C. baileyi, C. muris, C. parvum, Giardia Cysts, and viruses. Thus, it can be concluded that the ozone contactor is able to meet disinfection regulations.

Figure 6. CT distribution on the streamwise-vertical (x1-x2) plane at mid-span of the contactor for scenarios I-V (a-e, respectively). Note that, the flow direction is from right to left (i.e. from chamber #1 through #8).
Summary:In the present study, we developed a CFD-based (RANS-based) computational framework for the ozonation process in a full-scale ozone contactor and validated the framework via comparison with physical experimental data from the ozone contactor of the City of Tampa Water Department. The computed predictions of ozone concentrations at sample points agree well with the physical experimental data. Based on the predicted ozone concentration distribution, CT at the outlet was calculated for different scenarios. Average CT values at the outlet demonstrated that the full-scale ozone contactor studied is able to meet disinfection regulations.
Results of this initial attempt to combine CFD with a kinetics-based reaction model are encouraging. However, the reaction system in a contactor varies for different situations. Therefore, a good representation of the reaction system, including accurate reaction rate constants, should be obtained before applying a framework such as the one proposed here.