Research Highlight 3: Large-eddy simulations of wind and wave-driven turbulence and resulting vertical mxing in the coastal ocean
Under the auspices of the National Science Foundation and the Gulf of Mexico Research Initiative we have collaborated with oceanographers from the Center for Coastal Physical Oceanography at Old Dominion University (CCPO/ODU) and the CARTHE Consortium at University of Miami, working on large-eddy simulations of vertical turbulent mixing in the upper ocean mixed layer (UOML) and in shallow continental shelf (coastal) regions (10 to 30 meters deep).
The UOML is defined as the uppermost 30 to 70 meters of the ocean. Effects of turbulence generated by surface forcing mechanisms such as winds, waves and de-stabilizing surface heat fluxes are significant within the UOML and decay with depth.
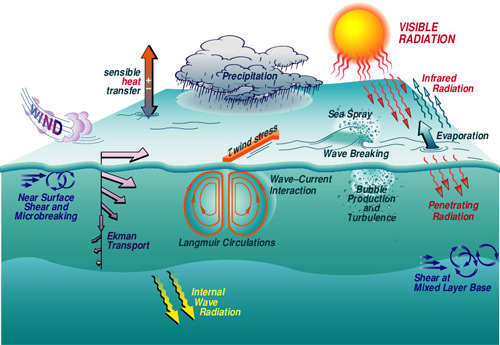
The upper ocean is forced by various mechanisms generating turbulent vertical mixing such as winds, wave-current interaction, wave-breaking and surface cooling (Figure 1). The vertical mixing induced by these mechanisms is important for determining vertical distribution of water constituents such as nutrients, pollutants, sediments, and micro-organisms such as phytoplankton that depend on exposure to light for photosynthesis. One of the vertical mixing processes we have investigated has been Langmuir circulations (LCs) generated by the wave-current interaction (i.e. the interaction between surface gravity waves and the wind-driven shear current).
|
Figure 1: Sketch (summary) of mechanisms that contribute towards either the production or suppression of vertical turbulent mixing in the upper ocean. Sketch obtained from http://www.whoi.edu/science/AOPE/dept/CBLASTmain.html |
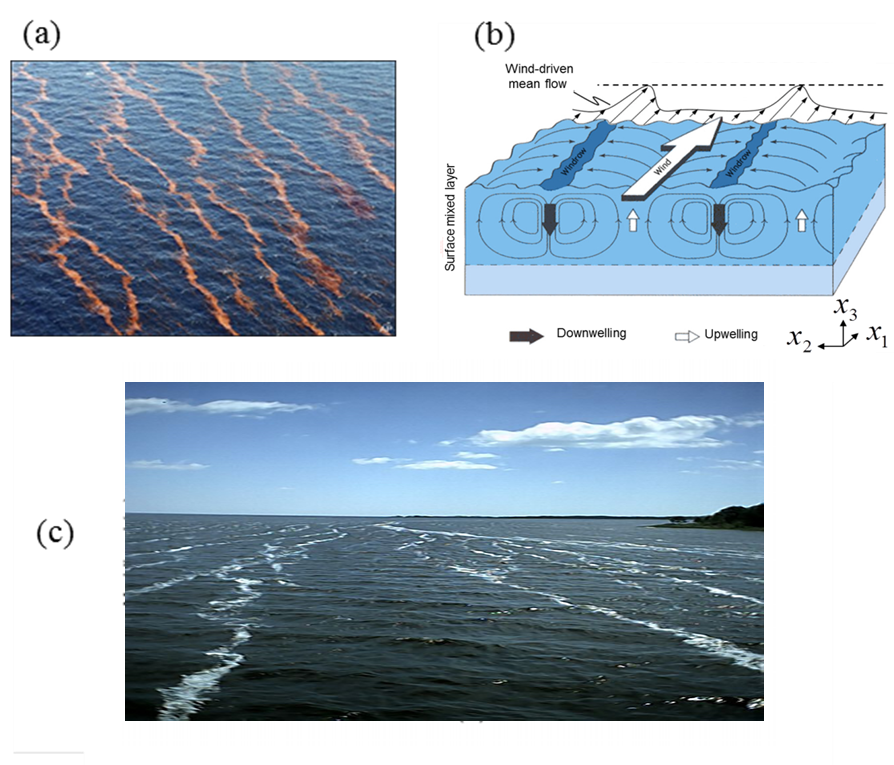
Historically, LC has been recognized as pairs of parallel counter-rotating vortices (or cells) oriented approximately in the downwind direction (Figure 2b), characterizing the wave- and wind-driven turbulence (i.e. the Langmuir turbulence) within the UOML in deep water. LC often occurs when winds and waves are roughly aligned and wind speeds are greater than 3 m s-1. The presence of LCs may be detected via the accumulation of foam and floating material along the surface convergence of the cells in what are often referred to as windrows. Figures 2a,c show lines of spilled oil and foam, respectively, set up by the action of LC. Spacing between the windrows or lines can reach up to 1 kilometer and the length of the windrows can reach up to several kilometers.
Our collaboration with oceanographers from ODU/CCPO has led to the numerical confirmation of field measurements of full-depth LC in shallow coastal regions. Previously LC had only been investigated/measured in the UOML over deep water where the cells extend to the base of the mixed layer as sketched in Fig. 1. The highly resolved field measurements of Drs. Ann Gargett at ODU in 15 meters-deep water supported by our highly resolved simulations forced by wind and wave conditions derived from the field measurements were the first to identify LC engulfing the entire water column (i.e. full-depth LC) in a shallow shelf coastal region. These measurements and more recently others have established full-depth LC as a dominant vertical mixing process heavily influencing sediment re-suspension and the bottom-bed boundary layer in the coastal ocean. Carefully guided by the field measurements, we have been able to perform LES of full-depth LC and have found favorable agreement between the computations and the in-water observations of the turbulent structure (see Figures 3 and 4). Results from these simulations have appeared in impactful journals such as Science and Journal of Fluid Mechanics.
|
Figure 2: Panel b shows a sketch of Langmuir cells highlighting their downwelling and upwelling limbs and the windrows (lines of foam and other floating material) that tend to accumulate along the surface convergence of the cells. Note the jet or increase in the downwind current coinciding with the surface convergence of the cells. Panels a and c show lines of spilled oil and lines of foam (windrows) accumulated along the surface convergence of the Langmuir cells. Photo in panel c is from http://www.ldeo.columbia.edu/~ant/Langmuir.html. Photo in panel a was taken during the Deep Water Horizon Oil Spill in the Gulf of Mexico. |
A comparison of the simulations with the field measurements of Dr. Ann Gargett during weak tides is given in Figures 3 and 4. Our large-eddy simulation is able to capture the main features of full-depth LC, manifested as a secondary, coherent turbulent structure advected by the mean shear flow. Notice that in both, field observation and simulation, the downwelling region (i.e. the region of negative vertical velocity fluctuations) of the cell coincides with a region of positive downwind velocity fluctuations. The latter results in the increased downwnid velocity or downwind jet coinciding with the windrows sketched in Figure 2b. Furthermore, the region of positive downwind velocity fluctuations in the simulation (Fig. 4) is characterized by near-bottom intensification similar to the field-measured structure (Fig. 3). Also note that the downwind and crosswind velocity fluctuations vary in the range +/- 8 cm s-1 and the vertical velocity fluctuations vary in the range +/- 4 cm s-1 in both field measurements and simulations.
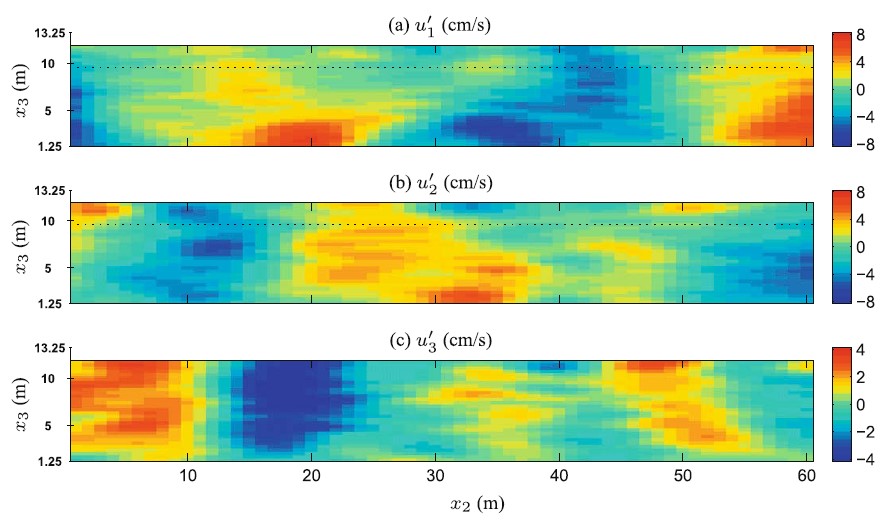
Figure 3: Instantaneous velocity fluctuations (cm/s) characterizing full-depth LC measured using a bottom-mounted ADCP (acoustic Doppler current profiler) at Rutgers' LEO15 cabled observatory in 15 m depth water off the coast of southern New Jersey. Horizontal axis shows crosswind direction and vertical axis shows vertical extent of water column. Panels show (a) downwind, (b) crosswind and (c) vertical velocity fluctuations. Measurements above ~10 m (denoted by a dashed line) were affected by ADCP sidelobe contamination. Figure is courtesy of Ann Gargett, Old Dominion University.
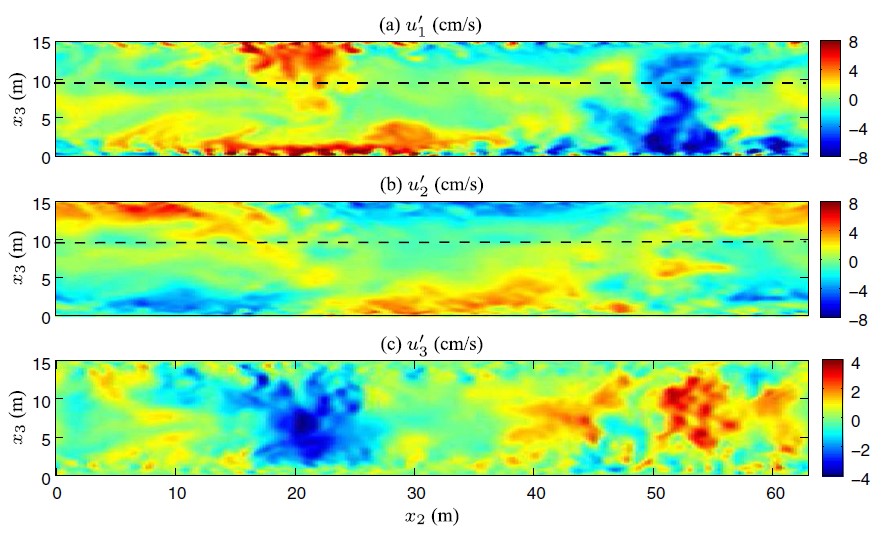
Figure 4: Instantaneous velocity fluctuations (cm/s) characterizing full-depth LC in simulation using wind and wave forcing following the LEO-15 measurements described in the caption of Figure 3. Order of panels and panel labels are same as in Figure 3. Arrows denote the surface convergence of the simulated Langmuir cell (in terms of the crosswind velocity fluctuations in panel b) and the downwelling limb of the cell (in terms of vertical velocity fluctuations in panel c).
More recently, working with the CARTHE consortium we have investigated the effects of surface cooling/heating and tides on the structure of the LC and the overall turbulence. The animation below is from one of our large-eddy simulations showing the effect of a cross-wind oscillating tidal force on the structure of the LC. The direction out of the page is the wind direction, thus we are seeing a crosswind-vertical slice through a pair of cells, similar to Figures 2b and 4. Initially the cells are well-organized/coherent, but as the crosswind tidal force picks-up, the cells are swept-up by the tidal current (moving to the left). As the tidal current weakens and reverses direction, coherent Langmuir cells re-emerge only to be swept-up again by the tidal current this time moving to the right.
One of our principal goals of these studies is to develop a parameterization of the turbulent mixing caused by these cells suitable for inclusion in coarse scale models of the general coastal ocean circulation. Due to their coarse grids, these models are not able to resolve LC and thus the vertical mixing induced by the LC should be accounted for through a turbulence parameterization in the coarse-grid models.