|
2012 U.S. Professor of the Year
Professor, OCW advocate, socio-economic diversity champion, one-pony pedagogy assailant, UDL believer, replicating education-research studies supporter.
|
|
|

|
HOME | NEWS | TEACHING | RESEARCH | STUDENTS | TEXTBOOKS | PUBLICATIONS | NEWS ARTICLES | CONTACT
|
|
PRESS RELEASE FOR TT FACTOR |
|||||||||||||||||||||||
|
|
October 26, 2009
FOR IMMEDIATE RELEASE Contact: Professor Autar K Kaw Telephone: 813-974-5626 Email: kaw@eng.usf.edu
Contact: Professor Ali Yalcin Telephone: 813-974-5590 Email: ayalcin@eng.usf.edu |
||||||||||||||||||||||
|
Chance magazine of the American Statistical Association published a paper in their October 2009 issue on "A Metric to Quantify the Topsyturviness of a College Football Season" written by Autar Kaw and Ali Yalcin. Kaw and Yalcin are professors in the College of Engineering at the University of South Florida. This press release gives a layman's description of the complete paper.
To garner attention of their audience, during every
college football season, news media, sports commentators, and bloggers
alike hope to have something to hyp In just Week#1 of the 2007 season, Associated Press (AP) No. 5 team University of Michigan lost to an unranked Division-II team - Appalachian State. The Associated Press wasted no time in booting Michigan out of the Top AP 25. Two weeks later, No. 11 UCLA lost to unranked Utah by a wide margin of 44-6. UCLA also met the same fate as Michigan; UCLA was dropped from the AP Top 25. The topsy-turvyness continued in the season, especially for No. 2 ranked teams. The University of South Florida, where I work, was ranked No. 2 when they lost to unranked Rutgers 30-27 in Week#8. This was the same week when three other teams (South Carolina, Kentucky, and California) ranked in the Top 10 of the AP poll also lost their games. To top off the season, for the first time in history of the Bowl Championship Series (BCS), the title bowl game had a team (Louisiana State University (LSU)) with two regular season losses, and LSU ended up winning the national championship. Although many ranted and raved about the anecdotal evidence of a topsy-turvy season, is it possible that the media and fans over-exaggerated the topsy-turvyness of the 2007 college football season. Were there other seasons that were more topsy-turvy than 2007? To answer this question scientifically, this article developed a metric to quantify the topsy-turvyness of the college football season. The authors are not aware of any previous literature that has attempted to develop a metric that quantifies the topsy-turvyness of any sport that is ranked regularly during its season. Two different topsy-turvy (TT) factors are calculated: one for each of week of the season, referred to as the Week TT factor, and one for the cumulative topsy-turvyness at the end of each week of the season, referred to as the Season TT factor.
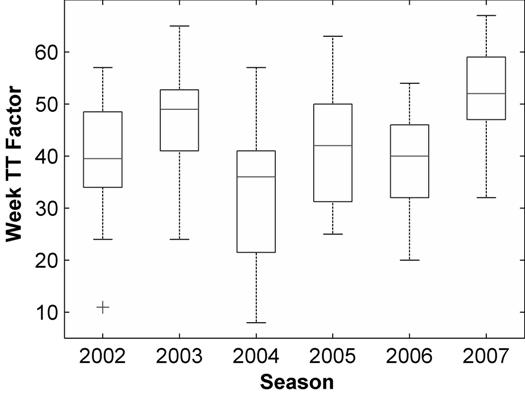
Week TT factor At the end of each college football week, the Associated Press (AP) poll rankings are calculated by polling 65 sportswriters and broadcasters across the nation. Each voter supplies his or her ranking of the top 25 teams. The individual votes are added by giving 25 points to the first place vote, 24 points to the second place vote, etc. The addition of the points then produces the list of the AP top 25 teams of the week. The method to find the Week TT Factor is based on comparing the AP Top 25 poll rankings of schools from the previous week to that of the current week. The difference in the rankings of each school in the AP Top 25 from the previous week to the current week is squared, allocating proportionately higher importance on bigger week-to-week changes in rankings for a given team. Figure 1 shows the plot of the week TT factors for seasons between 2002 and 2007. Clearly, 2003 and 2007 seasons emerge as the two most topsy-turvy seasons, while 2004 season materializes as a very stable season.
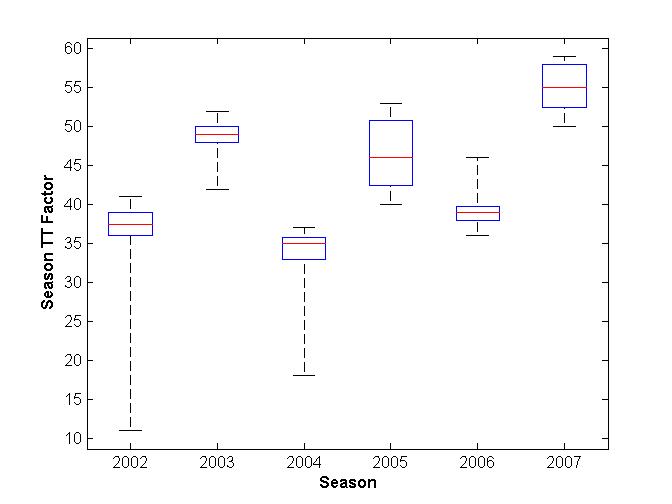
Season TT factor The Season TT factor is also calculated at the end of each week to gauge how topsy-turvy the season has been so far. The Season TT factor is calculated using weighted averages of the Week TT factors. Figure 2 shows a box-plot of all the season TT factors. Note that season 2004 was mostly a very stable season as compared to seasons 2007 and 2003. On the other hand, season 2005 that was mostly a "middle-of-the-way" season, exhibited high variability in weekly topsy-turvyness.
The end-of-season TT factor is shown in Table 1. Table 1. End-of-season TT factors.
We continue to monitor the TT factors for the current season at http://www.eng.usf.edu/~kaw/ttfactor |
|||||||||||||||||||||||
 e about. Luckily, for them, the 2007
season did give them something to talk about. One would be hard-pressed
to recall a more topsy-turvy season where highly ranked teams lost
regularly to low-ranked and unranked teams.
e about. Luckily, for them, the 2007
season did give them something to talk about. One would be hard-pressed
to recall a more topsy-turvy season where highly ranked teams lost
regularly to low-ranked and unranked teams.